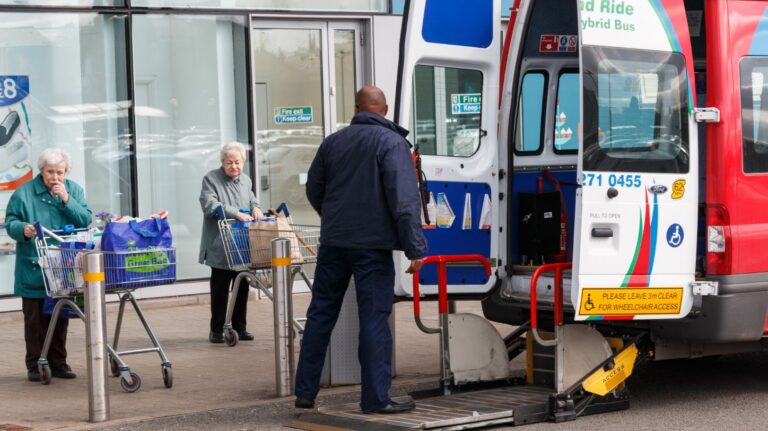
What is the appropriate role for demand-responsive bus services? Peter White explores the commercial viability of the concept versus conventional fixed-route operations…
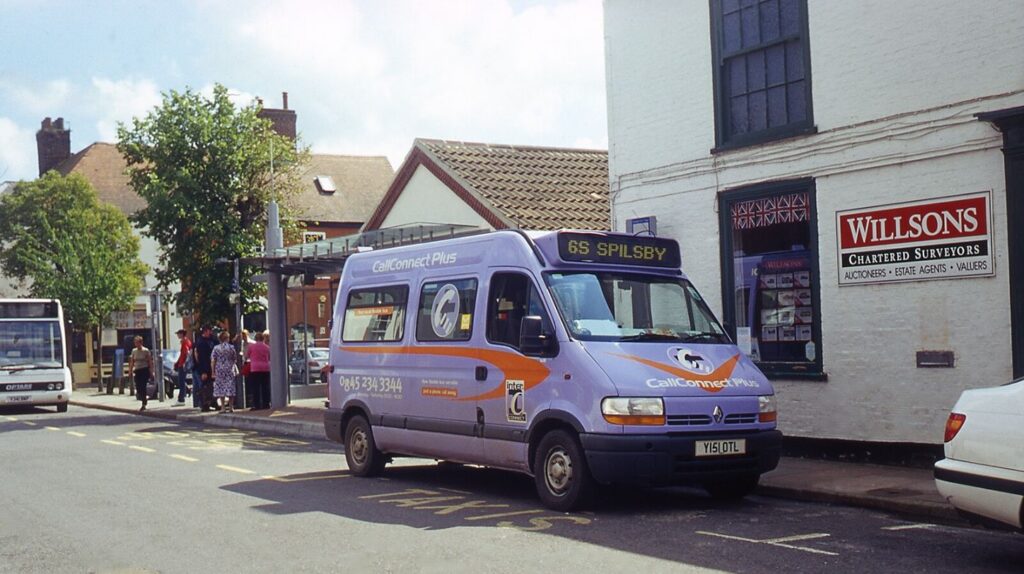
A great deal of publicity has been given in recent years to demand-responsive (DR) bus services, both in Britain and elsewhere. They apply innovative routing and booking methods to serve low-density demand in rural and some other contexts. A number of monitoring studies and other reports have appeared, but they often look only at DR services in isolation. Annual ridership levels in the thousands may seem substantial but should be seen in the context of those on conventional fixed-route services. To policymakers such services appear attractive, and extensive funding is currently provided by the UK Department for Transport (DfT) under its Rural Mobility Fund.
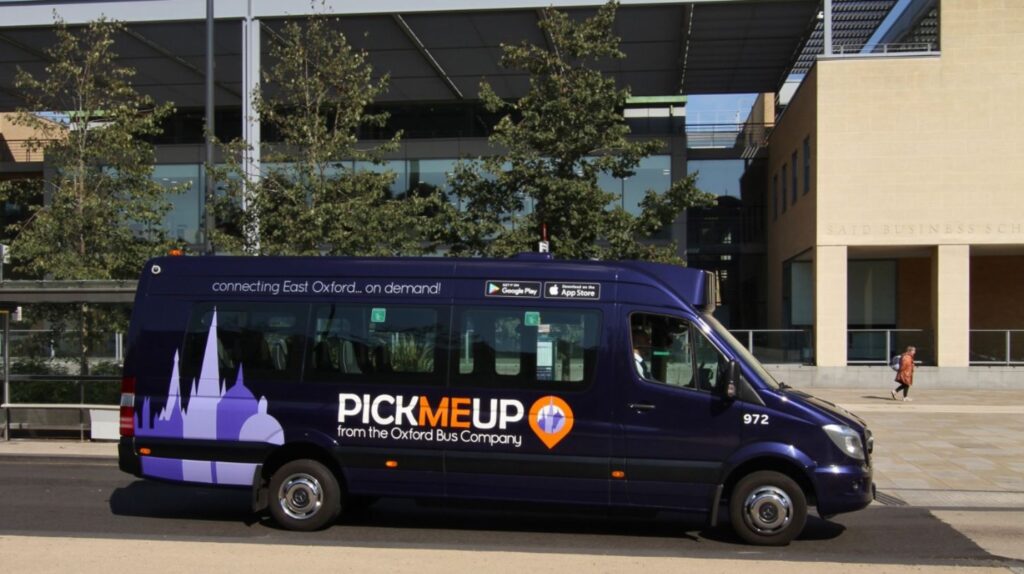
At the same time, a number of such services have been withdrawn following unacceptably high costs (and hence public spending) per passenger trip. Recent examples include an urban service in east Leeds, the ‘Yorbus’ service in North Yorkshire, the service in Watford, and even the long-established ’Bwcabus’ in West Wales. Some developer-funded services have also proved short-lived, that in the Leicester area being replaced by a fixed route in July 2023. Is there a danger of history repeating itself, when a wave of new services is followed by cuts a few years later as costs are found unacceptable?
Costs and benefits
Operating costs of buses are driven primarily by staff, especially drivers, who account for about 40-45% of all costs. If paid full-time staff are employed, these will apply to the small minibuses used for DR services as well as on fixed routes with larger vehicles. A slightly lower wage rate might be feasible, but given competing job opportunities, radically lower rates would not work. Further staff costs relate to engineering and management functions.
In terms of other operating costs, savings apply for fuel, maintenance and vehicle purchase, but do not necessarily fall pro rata with vehicle size (much as one finds for road freight, or aviation, services). Some additional costs arise from software and booking systems used for DR. A rough estimate would be a total cost per bus/km about 60-75% of that for full-sized vehicles, based on experience of intensive urban minibus services in the 1980s (1). A complicating factor is that when there is no demand for a specific journey, only marginal cost savings are made (mainly fuel), with fixed costs of driver and vehicle spread over a smaller output.
FAST FACT: 95% of English councils currently operate their DRT services at a loss. Source: County Councils Network
Unfortunately, there is very little data in the public domain for DR unit operating costs. For all bus services in England outside London (dominated by fixed-route services run with larger vehicles) the total operating cost per bus/km in 2022-23 was 278 pence (see DfT table Bus04gi_km), although one would expect lower costs in rural areas (for all sizes of bus) due to higher speeds.
The simplest definition of benefits is defined by customers’ willingness to pay, i.e. for a commercially-registered service in Britain, user revenues cover all costs (with revenues including the compensation paid to operators in lieu of fares, where they are required to carry a substantial proportion of passengers on concessionary passes giving fere travel). Bus operators also receive Bus Service Operators’ Grant (BSOG) related mainly to fuel used, counted as income by operators (these also apply to DR services).
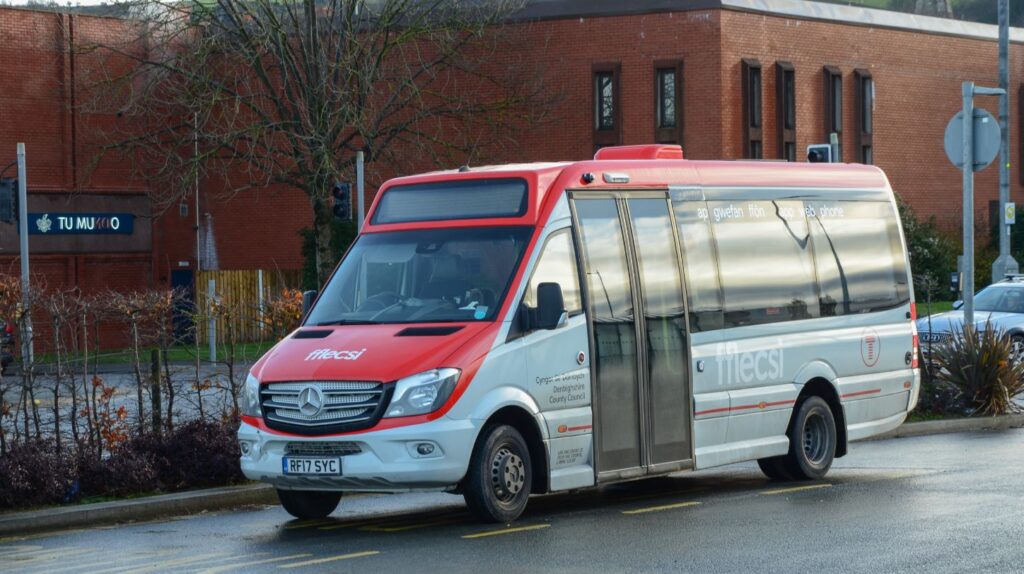
In reality, many low-density areas and times of demand (e.g. evenings and Sundays) do not support commercially-viable services and these are provided under contracts with local authorities effectively covering the net difference between revenues and total costs. They can be seen as providing wider benefits to their users, such as access to shopping and employment, and in some cases wider public savings, for example, enabling someone to access health services by remaining at home rather than becoming a hospital in-patient, resulting in lower public spending. However, these are not unique to a particular type of bus service provision and could, indeed, also apply to rail and taxi services.
At a broader level, we may wish to encourage modal transfer from car to public transport to reduce congestion, save energy and reduce emissions. However, this is likely to apply mainly to higher-density urban corridors, where bus loads are at least sufficient to mean that energy consumption and carbon emission are no higher than by car, and congestion is significant, which may not apply to very low-density rural services.
Another way of looking at this, as I have argued elsewhere (2) is to consider two objectives (beyond purely commercial operation):
- A usage objective, seeking to maximise public transport ridership, especially through modal diversion from car
- An area coverage objective, ensuring that everyone has a certain minimum level of service provision, even in low density rural areas
Clearly, DR services can contribute to the latter, but funds are not unlimited. Outside Britain, a somewhat different situation applies, in which public transport is not expected to be commercially viable, and a low ratio of revenue to costs is acceptable, such as, for example, in the USA.
Table 1: Passengers carried per bus per annum, from a sample of services:
- All bus services in England outside London, year to March 2023: 76,000
- Number of DR services carrying up to 6,000 passenger trips per bus: 10
- Number of DR services carrying 6,001 to 10,000 passenger trips per bus: 4
- Number of DR services carrying more than 10,000 passenger trips per bus: 3
Sources include the DfT ‘Rural Mobility Fund Evaluation: Interim report’ October 2023 (3), covering nine cases; technical press reports; and presentations to professional groups. The overall average is derived from DfT tables Bus01a and Bus06b. Note that the latter includes tendered services, and the industry was still receiving post-Covid recovery funding: for purely commercial operation a higher figure would be needed. The category of ‘more than 10,000’ comprises the PickMeUp services in Oxford (now withdrawn, but probably the closest to commercially viable operation attained to date) and in High Wycombe (still in operation), together with that in Orleans, France.
FAST FACT: 3 in 4 of England’s largest councils are rolling out DRT services to fill the gap left by dwindling mainstream bus services. Source: County Councils Network
Clearly, no-one would expect the DR services to be anywhere close to the national average for all services, but what is striking is how much lower they are, given the fact that costs do not fall pro rata with vehicle size. A further feature is that the lowest density services may incur substantial totally empty running (akin to a taxi service between pick-ups), as indicated in the DfT study (3) with about half the distance covered by vehicles comprising empty running (table 9). The outcome is a very high cost per passenger trip made.
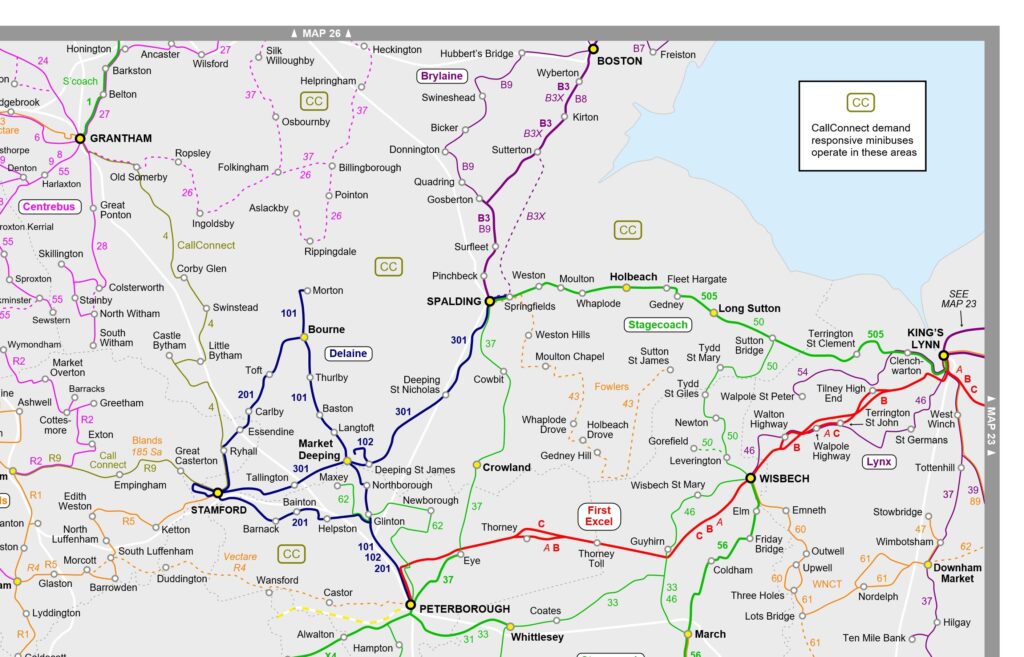
A recent report from the County Councils Network (CNN) (4) indicates that from a sample of 20 rural authorities, a large proportion were running DR services, but less than 20% of respondents considered such services financially viable in the long run, and only 5% were not running at a loss. It called for more secure long-term funding for both fixed route and DR services.
Some possible ways forward
Scope may exist for greater integration between public DR services and other activities. Already, many fixed route services in rural areas carry substantial numbers of schoolchildren, varying their schedules at school times to do so. For example, if a DR minibus carried 10 schoolchildren in the morning and again in the afternoon for 190 days per year this would represent 3,600 passenger trips per year, forming a large increase on existing volumes for services carrying fewer than 6,000 trips per year per bus, and substantially reduce the net public expenditure per passenger trip. At a broader level, the ‘Total Transport’ concept tested in Britain a few years ago indicated considerable scope for integration with services such as non-emergency health transport, with overall savings. This was limited by institutional factors but could be worth re-visiting.
A legitimate criticism of many fixed-route bus services is that they do not respond to new patterns of demand. Operating DR services for a limited period may act as a form of ‘market testing’ in which such demand can be identified, either by overlaying DR services on an existing fixed-route network, or completely replacing it for a limited period. The public expenditure per trip may not be sustainable in the long term, but a revised fixed-route network can then be
designed drawing on data collected during DR operation. One example can be seen in Sunday services in Newport, South Wales, where fixed routes were replaced for a period by DR services, and a revised fixed-route network then introduced.
In the longer-term, automated vehicles could enable drivers to be removed entirely, with a dramatic reduction in costs. Several years ago, there was an expectation that this could occur soon, now seen as naïve, which also resulted in studies conflating minibus use with driverless operation. Nonetheless, scope may exist. However, if automation becomes acceptable for DR services, then surely it is equally (if not more) feasible and acceptable for fixed-route operation? One can see scope for reviving the success of high-frequency minibuses in urban areas of the 1980s through stimulating demand growth by high frequency.
In conclusion, what is needed are consistent criteria for evaluating DR and fixed-route bus services, along with other transport options. This could encompass measures of accessibility, user journey time and public expenditure per trip.
[References]
- P.F. Watts, R.P. Turner and P.R. White Urban minibuses in Britain: development, user responses, operations and finances. TRRL research report 269, 1990
- Peter White ‘The Roles of ‘Conventional’ and Demand-Responsive bus services’ chapter 15 in Corinne Mulley and John Nelson (eds) Paratransit: Shaping the Flexible Transport Future, Emerald, Bingley, U.K. 2016.
- Pantelaki, E., Chatterjee, K. & Nawathe, V. Rural Mobility Fund Evaluation: Interim Report. Report to Department for Transport, 2023
- County Councils Network (CCN) News Release on Survey of Local Authorities re demand-responsive services, 25 October 2023
This article was authored by Peter White, an Emeritus Professor of Public Transport Systems at the University of Westminster’s School of Architecture and Cities. It originally appeared in the February 2024 issue of CiTTi Magazine.
Achievements and innovations in public transport will be celebrated at the third annual CiTTi Awards, which will be held on 26 November 2024 at De Vere Grand Connaught Rooms in London. Nominations are now officially open! Please visit www.cittiawards.co.uk to learn more about this unmissable event for the UK’s transportation sector.

