When assessing the value of toll roads, could ‘time saved’ be a better benchmarking metric than the industry-standard ‘value for money’ approach? Transport analysts Dr Robert Bain ad Sylvain Sénéchal believe so…
In the toll road sector, benchmarks are used to shine a light on the attractiveness of a facility to consumers. In the context of traffic and revenue forecasting, they are commonly cited in support of the more ambitious predictions of demand. In short, they are used to signal value for money – and this has important and widespread implications.
Policymakers and the public are more likely to support toll roads that represent a strong value for money proposition. Rating agencies, debt providers and insurers regard good value for money as being credit positive. And equity financiers regard good value for money as being investment positive.
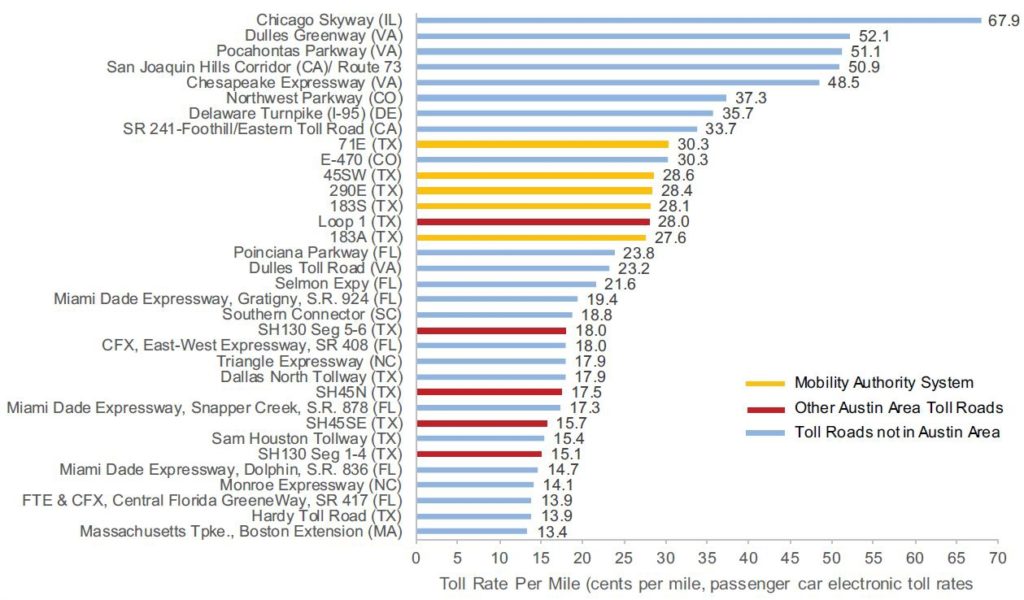
The industry-standard benchmark for value in the toll road sector is cost per mile. How much does travel cost and how does the unit cost of using a specific road, bridge or tunnel stack-up against others? This is regularly presented in consultants’ reports (Figure 1).
At first glance, the cost per mile metric appears to have some attractive qualities. Top of the list is data availability and ease of calculation. All that is needed is the length of the asset and the respective toll price – information generally in the public domain. However, computational convenience and usefulness are two separate matters. And computational convenience quickly falls away when you get into the details.
On multi-access facilities, different users make different trips of different lengths. So, what distance should be used? And toll tariffs vary by vehicle class, time of day, payment method, trip length, discount eligibility and so forth – so what cost should be used? For this reason, simplifying assumptions are adopted by benchmarkers, the details of which often remain frustratingly opaque.
These data standardisation challenges can be overcome; however, a critical issue remains. Cost per mile – essentially price – is being used as a proxy for value and this is a fundamentally flawed metric.
Proxy metric shortcomings
From an economics perspective, cost per mile is focussed on supply. It attempts to summarise a toll facility in terms of two of its physical attributes: length and price. This is like benchmarking restaurants simply by comparing the kitchen floorspace. It conveys nothing about demand, or the consumer utility derived from goods and services. That is where the benchmarking metric needs to focus if value is to be assessed and communicated. What do consumers respond to? What are they paying for?
As most toll facilities operate in a competitive environment, consumers have a choice. They are not responding to facility length. Consumers respond to the amount of time saved compared to alternative route options, which they evaluate in the context of the price point.
Herein lies the danger. The proxy metric, cost per mile, may be related to time saved. However, if the benchmarking sample is not populated with near-identical facilities, that relationship quickly breaks down.
A cost-per-mile comparison of toll facilities with different features and offerings ignores the reality of the consumer experience. At best it is a questionable metric. At worst it is a misleading value for money indicator. Therefore, cost per mile comparisons should be ignored and quantifying, understanding and benchmarking cost per minute saved should be focused on instead.
Hypothesis and dataset
To illustrate the point, some original research relying solely upon publicly available data was undertaken. This introduced limitations; however, it demonstrates what can be achieved quickly, without having to commission expensive traffic surveys or purchase mobility data from third-party vendors.
Importantly, it is reproducible. Interested parties can replicate what has been done and incorporate it in their own due diligence of target toll facilities. However, the primary objective was to calculate cost per minute saved for a large sample of toll facilities and contrast the results with cost per mile benchmarks.
Cost per mile comparisons commonly rank toll facilities in order; ascending or descending depending on the preferences of the benchmarker. If price (cost per mile) is a good proxy for value (cost per minute saved), then a comparison of both metrics should result in identical – or near-identical – rankings. This is the hypothesis we set out to prove/disprove.
The research assessed 68 US toll bridges and tunnels that were similar in nature and didn’t hold monopolies in a specific region. Of the 68, 43 tolled in both directions with 25 tolling in a single direction, giving 111 user-paid routes for comparison against their toll-free competitors. This is substantially more than is shown in traditional cost-per-mile-based benchmarking.
The focus on toll bridges and tunnels was pragmatic as these tend to be short-distance facilities that offer meaningful time savings. Whereas cost per mile makes little sense for longer toll roads, it makes no sense at all for facilities that are generally just a couple of miles in length. Despite this, cost-per-mile comparisons of toll bridges and tunnels are still found in consultants’ reports.
The analysis
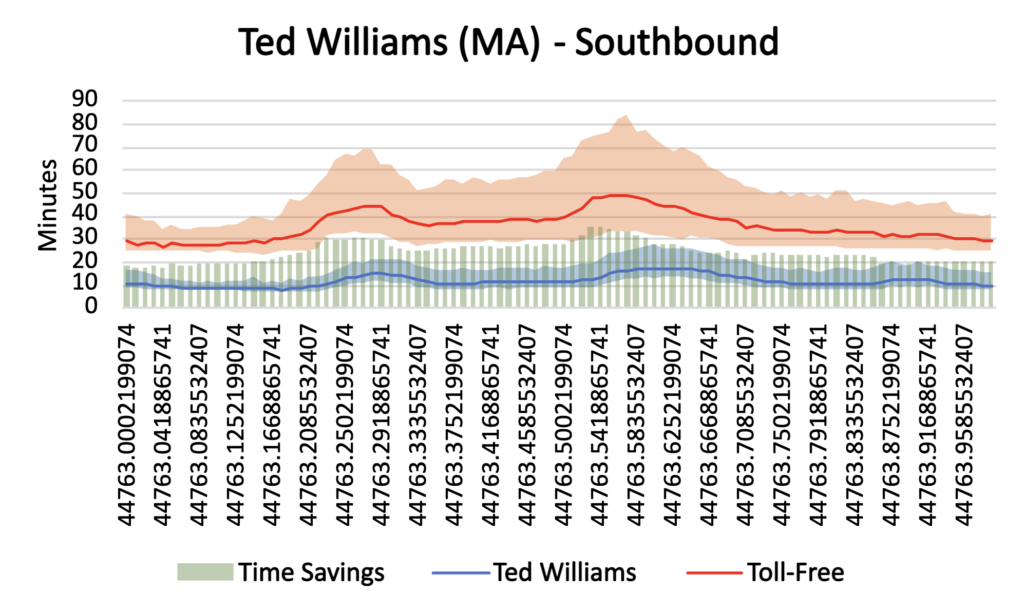
The analysis involved a five-stage process that included compiling travel time savings using Google Map’s Directions Application Programming Interface (see Figure 2) and toll tariffs using the US Federal Highway Administration’s online tariff schedules for each facility to compile their passenger car rates for 2022. This retains consistency with traditional cost-per-mile benchmarking, which is generally based on cash/electronic toll collection rates.
The analysis also included adjustments for local purchasing power. The Bureau for Economic Analysis (BEA), part of the US Department of Commerce, highlights how the cost of living (buying power) varies considerably from state to state. In summary, US$1 in California buys a lot less than it does in Arkansas. This fact is ignored in all the cost-per-mile benchmarking reviewed as part of this study; despite comparing facilities from different states.
The BEA publishes regional price parities wherein the differences in price levels across US states and metropolitan areas for any given year are expressed as a percentage of the overall national price. This was used to adjust the toll tariffs – a proxy for regional value of time differentials. The adjustment range was +/-20%.
The research also estimated ‘reference value’ time savings, which are those that would be economically justified given the toll tariffs and a specified value of time. Effectively the tolls were converted into their time-saved equivalent. The value of time used to produce these reference-values was that recommended by the US Department of Transportation – US$17/hour in 2022.
Finally, the research generated initial value for money estimates. The calculation represents the difference between the typical time savings experienced by users and the reference-value time savings. To allow comparison across a range of facilities, this difference is expressed as a ratio.
This ratio can be used in various ways. At its simplest, bigger ratios reflect greater value for money, which is more attractive to consumers. However, ratios above unity can also be interpreted as a measure of consumer surplus, the extent to which toll bridges and tunnels are undercharging, or the headroom available for increasing the price. Similarly, the variations in time savings across the day (Figure 2) indicate the potential to implement time-of-day (revenue optimising) pricing strategies and the range differentials suggest the extent to which journey time reliability could be a key selling point for a toll facility.
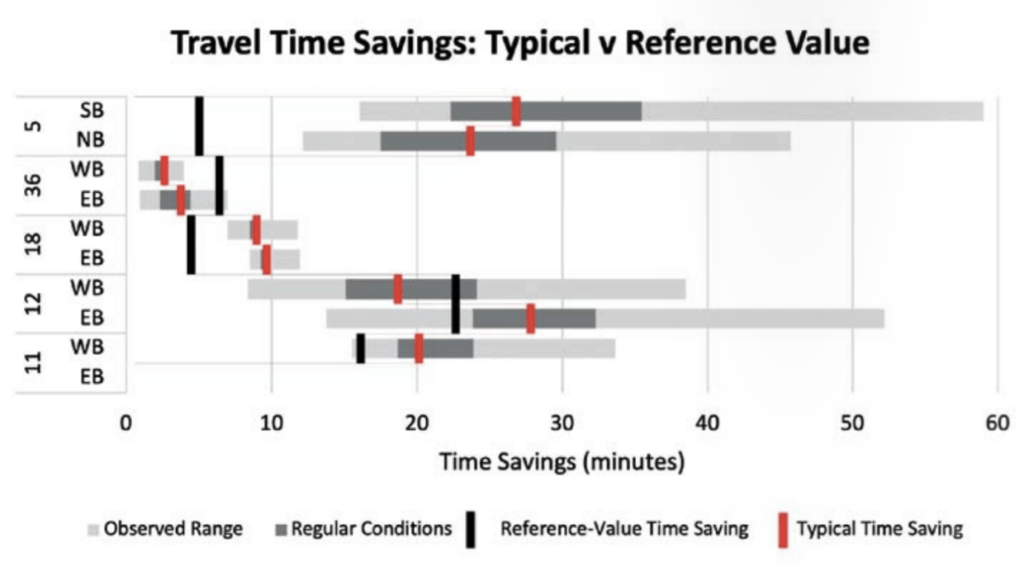
Some estimates are shown in Figure 3. Value for money is the difference between the typical time saving (red vertical marker) and the reference time saving (black vertical marker).
The sample-wide findings are summarised in Figure 4. The black line represents reference-value time savings (using the USDOT-recommended value of time). Using an alternative value of time simply alters the gradient. It has no impact on the position of the markers themselves and no impact on the ranking in terms of cost per minute saved.
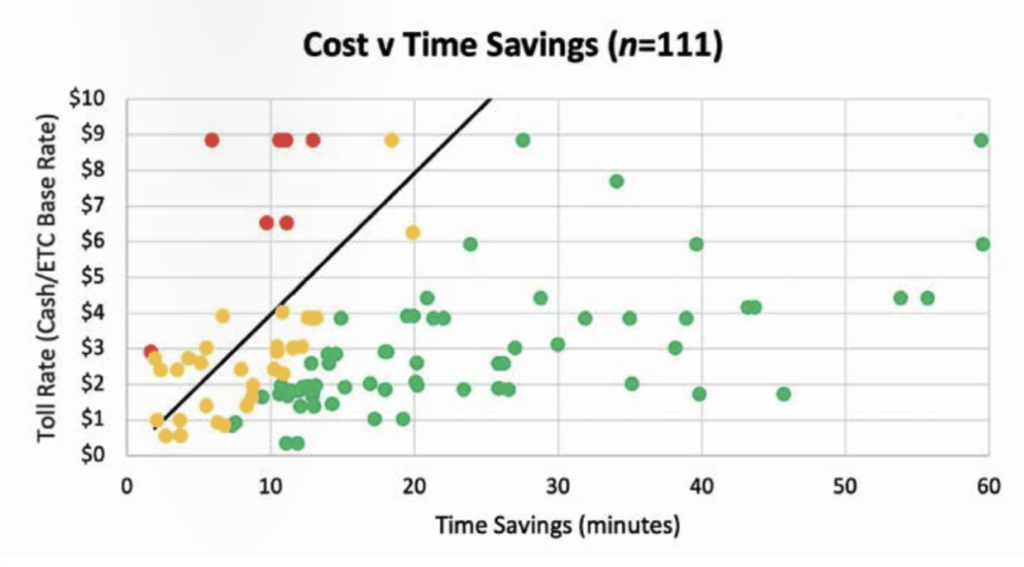
The orange markers are those facilities for which the time savings on offer are broadly in line with expectations (the reference-values). The green markers represent particularly good value for money. The red markers reflect facilities where the value for money proposition is more challenging.
Research results
Bain and Sénéchal have been undertaking commercial due diligence of toll roads, bridges and tunnels for more than 10 years and, as a result, have amassed a library of nearly 300 traffic and revenue reports. Their library contains full reports for 20 toll bridges and tunnels in the USA. As such they were able to compare the high-level value for money results presented here with the findings from technical studies that examined each asset in detail.
According to the research, there was strong alignment. A number of bridges and tunnels represented by the green markers were commented upon favourably by consultants. Their surveys, modelling and conclusions pointed to strong competitive positioning. As for the red markers, Bain and Sénéchal are currently retained in an advisory capacity by one of the asset owners who is struggling to generate the cash flows anticipated by investors.
Having prepared the time saving estimates, the researchers set them against their respective tariffs. Then, like the cost-per-mile benchmarks, ranked them – a representative selection of which is presented in Figure 5. This table shows 15 bridges/tunnel ranked from high (red) to low (green) using total cost at the control (1st = most expensive). Alongside this, the respective rankings by cost-per-mile (price) and cost-per-minute saved (value) are shown. The Throgs Neck Bridge in New York, for example, is one of the most expensive facilities in terms of total cost (red). It ranks in the top half of the sample by cost-per-mile (relatively high cost – shown in orange) yet drops to the bottom half by cost-per-minute saved (relatively low cost – in green).
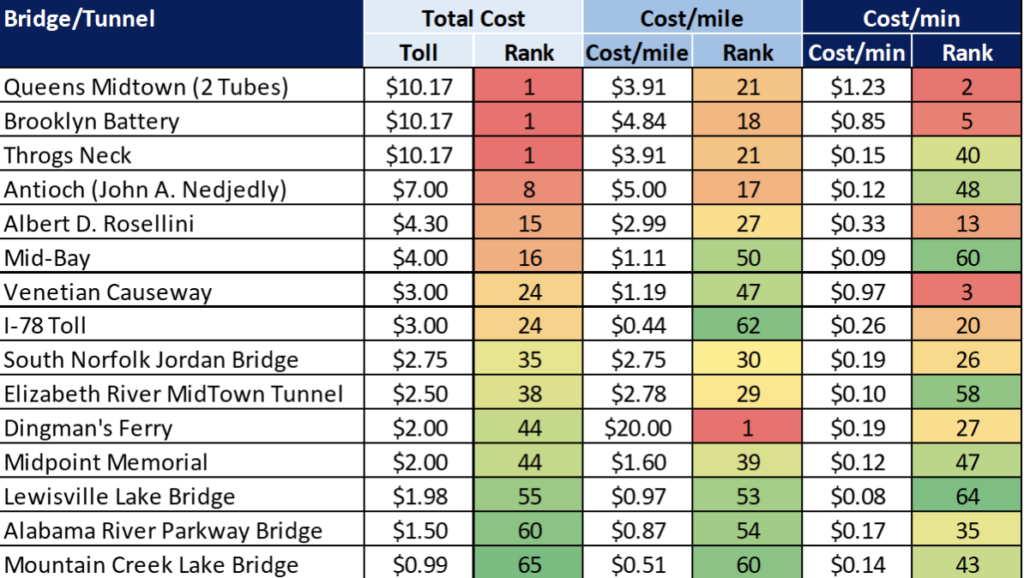
To prove their hypothesis, the researchers had to demonstrate that the price and value rankings were similar. However, the alternative metrics result in very different rankings, which means that price is not an effective proxy for value. Value-based conclusions cannot be drawn from price alone.
Closing remarks
It could be argued that cost-per-mile benchmarking is a harmless exercise focused solely on price, and that price comparisons still have a role. Yet it is the toll road industry itself that makes frequent and explicit connections between cost per mile and the value of a project.
As for the role, that remains unclear. Figure 1 compares a beltway around Raleigh, North Carolina (population 500,000) operated by Triangle Expressway with a privately-operated commuter corridor feeding the nation’s capital from its affluent suburbs (Dulles Greenway additionally serves the region’s large international air hub).
In other published benchmarking exercises, short toll roads (less than five miles) are compared with entire systems (approaching 500 miles), again masked by the cost-per-mile metric. Without deep industry knowledge, it is difficult for anyone to know exactly what they are looking at other than a ranking of facilities with the bar of interest appearing around the middle or toward the lower end of the range.
As for being harmless, although the readership of consultants’ reports may be limited, cost-per-mile benchmarks are frequently carried forward to pitchbooks, equity research reports, slide decks for investors, internal presentations to credit committees or investment boards and, in the case of Figure 1, bond disclosure documentation, all with a far broader and more diverse audience.
Somewhat ironically, time savings – not per-mile costs – lie at the heart of what traffic and revenue consultants do. In forecasting models, trade-offs between journey times and the costs of travel dictate route choice – the number of vehicles that will use a toll facility. This is seldom reported in detail and is never benchmarked. Instead, it remains hidden in the ‘black box’, something that could be rectified by more demanding clients.
In summary, toll price should not be confused with project value. As a benchmark, cost per mile is dead. It’s about time.
This article is based on the white paper, ‘It’s About Time’, by Dr Robert Bain, honorary professor at University College London, and Sylvain Sénéchal, managing director, CS Infrastructure Advisory Group. Corresponding author: r.bain@ucl.ac.uk.
This article was originally published in the February 2023 issue of CiTTi Magazine. Read the original article.

