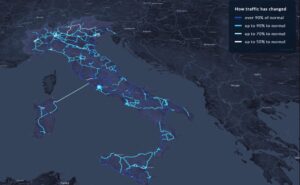
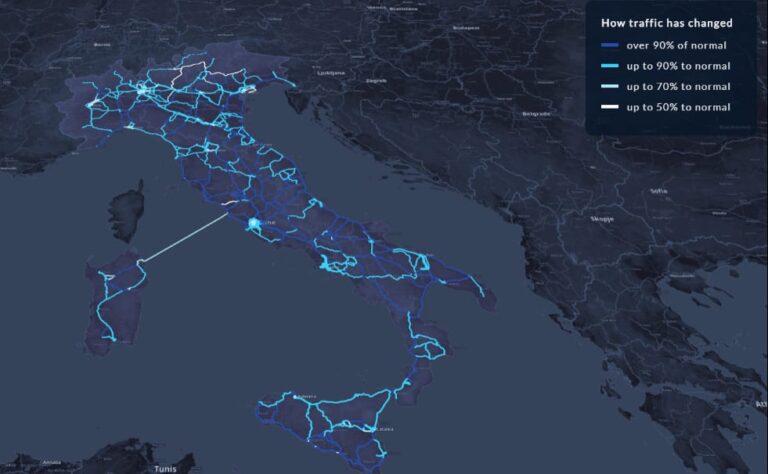
A new nationwide interactive digital map of Italy shows how traffic volume and mobility behaviour has changed in the country during the coronavirus lockdown.
The visualisations have been realised by software company PTV Group based on mobility insights by Swiss company Teralytics.
The interactive map of Italy allows users to compare pre-lockdown traffic (from 18 February) with traffic volume during the lockdown phase (18 March) as well as with current traffic.
According to PTV, average traffic load in Italy during lockdown was 70% below ‘normal’ traffic in mid-March.

However, the map also shows that traffic has largely increased since the loosening of restrictions, with 82% of pre-lockdown traffic back on roads.
Adversely, traffic volume in some of Italy’s largest cities, such as Rome, Venice and Milan, is still down, at around 50% or less compared to pre-lockdown levels.
This, said PTV, is attributed to the fact that many people are still working remotely or travelling by bicycle more often in urban areas.
“Data-driven mobility visualisations are a strong tool in decision-making processes for future mobility and infrastructure measures,” said Frédéric Reutenauer, PTV regional managing director for Southern Europe.
“Authorities and traffic planners not only receive detailed and meaningful figures on traffic volumes and the impact on the road network, but our tools also help to test and evaluate different traffic-related issues in advance and thus plan ahead.”
Read more from CiTTi
https://www.cittimagazine.co.uk/dft-using-local-authority-traffic-data-to-manage-lockdown-relaxation/
https://www.cittimagazine.co.uk/survey-reveals-traffic-concerns-post-pandemic/


